The Cost of Dumping:
A Year of BRETT Swaps Analysed
How TWAP execution changes the economics of large token sales on Base.
Every week, traders on Base try to sell large positions in low-cap tokens and get destroyed by price impact. They watch the number in the "you receive" field drop as they type. They hit confirm anyway because they don't have a better option.
We analysed 4,904,179 real BRETT swaps across Uniswap V3 and Aerodrome on Base — filtered out bots, MEV sandwiches, and dust — and simulated what a Slicr TWAP order would have gotten vs an instant swap across 2,595 scenarios.
The Data
We filtered 4,904,179 raw swaps across two venues down to 161,977 clean human trades using five sequential filters: dust removal (<$1K), high-frequency bot detection, block density, sandwich pair detection, and bot pattern removal. Filters are conservative — results understate the TWAP advantage, not overstate it.
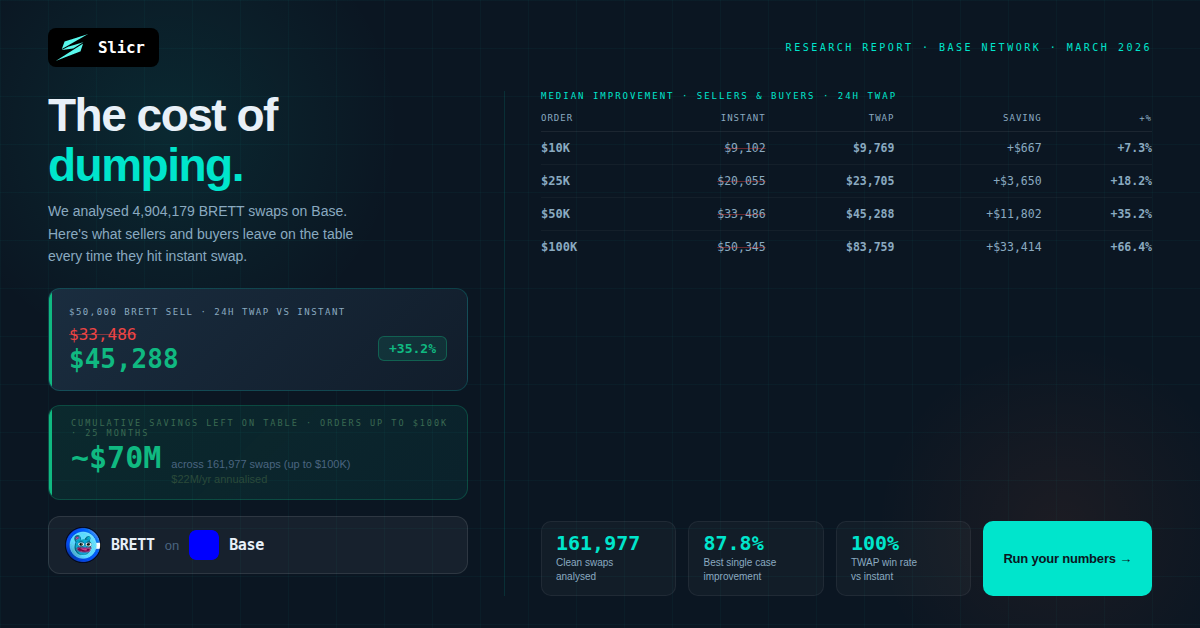
Results — Savings at a glance
| Order size | Est. % of swaps | Est. % of volume | Median saving |
|---|---|---|---|
| ≥ $10K | ~8% | ~45% | +$667 (+7.3%) |
| ≥ $25K | ~3% | ~28% | +$3,650 (+18.2%) |
| ≥ $50K | ~1% | ~18% | +$11,802 (+35.2%) |
| ≥ $100K | <1% | ~12% | +$33,414 (+66.4%) |
TWAP benefits sellers and buyers equally — AMM price impact is symmetric.
Cumulative savings — ~$70M left on the table
Across all 161,977 clean swaps up to $100K across both venues, an estimated ~$70M was left on the table by instant swappers — ~$47M on Uniswap V3 and ~$25M on Aerodrome. Both figures are directly modelled, no extrapolation.
TWAP won 100% of the time
Across all $50,000 simulations using a 24h TWAP, TWAP outperformed instant swap 100% of the time — on both Uniswap V3 (89 weeks) and Aerodrome (84 weeks). Not one exception. The median saving on a $50K order was $11,802 — against a Slicr fee of ~$150. That's a 79:1 value-to-fee ratio.
Aerodrome: Consistent Direction, Uniswap V3 Slightly Stronger
We ran the same backtest against 59,119 clean Aerodrome swaps covering May 2024 through March 2026. The TWAP advantage holds on Aerodrome too — same direction, slightly lower magnitude. For BRETT, Uniswap V3 outperforms Aerodrome by 2–3 percentage points across all order sizes:
| Order | Uniswap V3 (24h TWAP) | Aerodrome (24h TWAP) |
|---|---|---|
| $5K | +3.6% (+$170) | +3.3% (+$156) |
| $10K | +7.3% (+$667) | +6.7% (+$617) |
| $25K | +18.2% (+$3,650) | +16.8% (+$3,418) |
| $50K | +35.2% (+$11,802) | +32.6% (+$11,206) |
| $100K | +66.4% (+$33,414) | +61.6% (+$32,294) |
Win rate: 100% on both venues across all order sizes and durations tested.
The five largest swaps
These five wallets each had fewer than 25 lifetime on-chain transactions. Each sold between $339K and $412K in a single instant swap. Each left an estimated $180K–$220K on the table.
| # | Date | Volume | Est. instant out | TWAP sim (24h) | Est. saving |
|---|---|---|---|---|---|
| 1 | Apr 26, 2024 | $412,275 | ~$105,800 | ~$327,600 | ~+$221,800 |
| 2 | Apr 20, 2024 | $359,863 | ~$103,900 | ~$303,500 | ~+$199,600 |
| 3 | Apr 20, 2024 | $358,888 | ~$103,700 | ~$302,700 | ~+$199,000 |
| 4 | May 16, 2024 | $349,230 | ~$102,900 | ~$295,200 | ~+$192,300 |
| 5 | Apr 21, 2024 | $339,281 | ~$101,800 | ~$287,600 | ~+$185,800 |
TWAP outputs extrapolated beyond $100K model ceiling — treat as directional.
Transaction hashes (verify at basescan.org):
Caveats
- AMM formula is V2 constant-product — slightly overstates impact vs real V3
- Pool liquidity estimated from rolling median swap sizes (active depth, not total TVL) — DeFiLlama cross-check confirms ~87:1 TVL-to-active-depth ratio
- TWAP gains come from arb recovery, organic market flow, and price drift between slices — not from LPs
- Concurrent large sellers compete for the same recovery; figures are single-order simulations