$103M Left on the Table:
Two Years of DEGEN Swaps
How TWAP execution changes the economics of large token sales on Base.
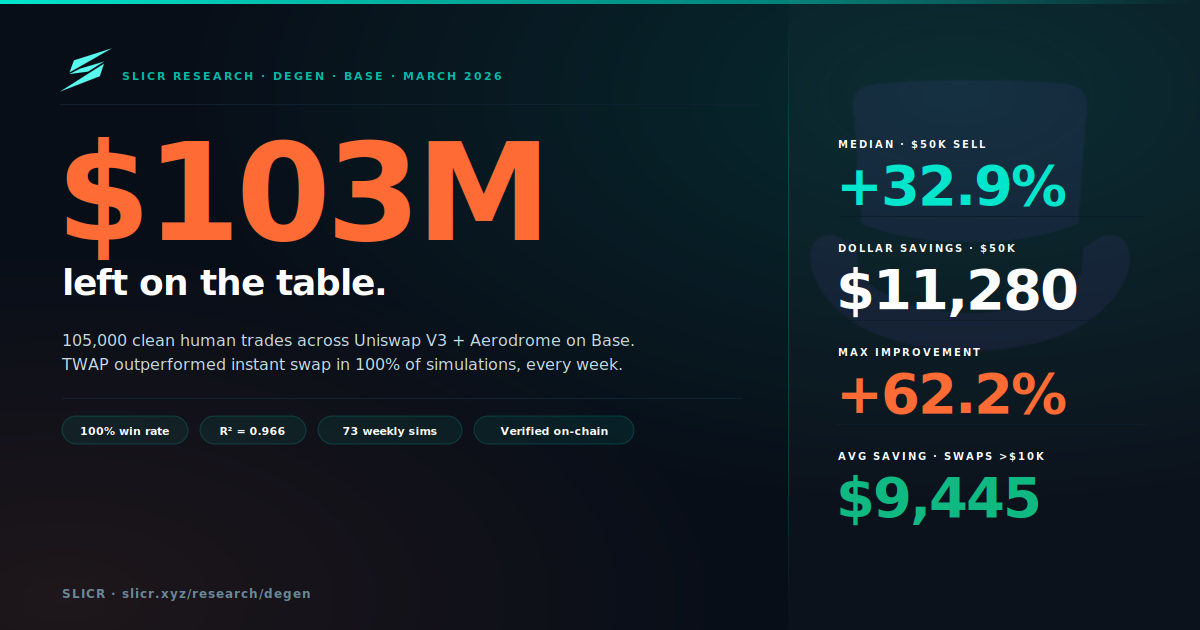
We scanned 8,037,577 on-chain transactions across Uniswap V3 and Aerodrome on Base, fetching 4,184,612 raw DEGEN swaps. After applying nine filters to remove bot activity, MEV sandwich attacks, and dust trades, 105,000 clean human trades remained — 86,879 on Uniswap V3 and 18,121 on Aerodrome.
Core Results
We simulated what a Slicr TWAP would have returned versus an instant swap across 73 weekly periods. TWAP outperformed instant swap in 100% of simulations for orders above $5K.
| Order Size | Instant Output | TWAP 24h Output | Improvement |
|---|---|---|---|
| $5,000 | $4,781 | $4,938 | +3.3% (+$157) |
| $10,000 | $9,160 | $9,783 | +6.8% (+$623) |
| $25,000 | $20,340 | $23,786 | +16.9% (+$3,446) |
| $50,000 | $34,289 | $45,569 | +32.9% (+$11,280) |
| $100,000 | $52,180 | $84,618 | +62.2% (+$32,437) |
Median values, 73 weekly simulations, 24h TWAP, 10 slices, 30 bps fee deducted.
Pool depth drives TWAP improvement (R² = 0.966)
Pool depth explains 96.6% of the variance in how much TWAP helps. Every additional $10,000 of pool liquidity reduces the median improvement by 1.48 percentage points. DEGEN's pool depth has fallen ~29% since launch — the TWAP advantage is growing over time. A $50K exit that would have improved by 32.8% in 2024 now improves by 45.2%.
Price direction doesn't matter
The improvement is statistically indistinguishable across rising (+33.3%), flat (+33.6%), and falling (+32.9%) markets. TWAP's benefit comes from AMM mechanics — arb bots restoring the pool price between slices — not from price direction.
Whale case study: $437K in avoidable losses
One wallet executed 11 DEGEN transactions between March and May 2024 — seven buys totalling 674.30 WETH (~$2.44M) and four sells totalling $1,070,405 USDC. The buys deployed ~$1M per pair into a pool with only ~$223K depth, hitting ~82% estimated price impact on back-to-back transactions.
- Actual net P&L: −$1,370,561
- With Slicr TWAP: −$933,717
- Savings: +$436,844 · Fee ROI: 42×
All 11 transaction hashes are in the full report for independent verification.
Cumulative savings: $103M
| Order bucket | Swaps | Net savings |
|---|---|---|
| $1K–$5K | 131,100 | $4.4M |
| $5K–$10K | 22,108 | $7.2M |
| $10K–$25K | 14,550 | $23.0M |
| $25K–$50K | 3,850 | $30.9M |
| $50K–$100K | 1,460 | $45.9M |
| >$100K | 690 | $94.3M |
| Total | 86,879 | $102,855,439 |
94% of savings came from 10,275 swaps above $10K (11.8% of all trades).
Caveats
- AMM formula is V2 constant-product — slightly overstates impact vs real V3
- Pool depth estimated from rolling swap medians (active depth, not total TVL)
- Competing sellers not modelled — figures are single-order simulations
- Medians reported rather than means for robustness to model error