Every week, someone sells a large DEGEN position and gets worse execution than they deserved. Not because the market moved against them. Not because of bad timing. Because they hit "swap" on a pool that couldn't absorb their order without moving the price against them — by 30%, 40%, sometimes more.
We wanted to know exactly how bad it is. So we pulled every DEGEN swap on Base for the past two years and measured it.
The Dataset
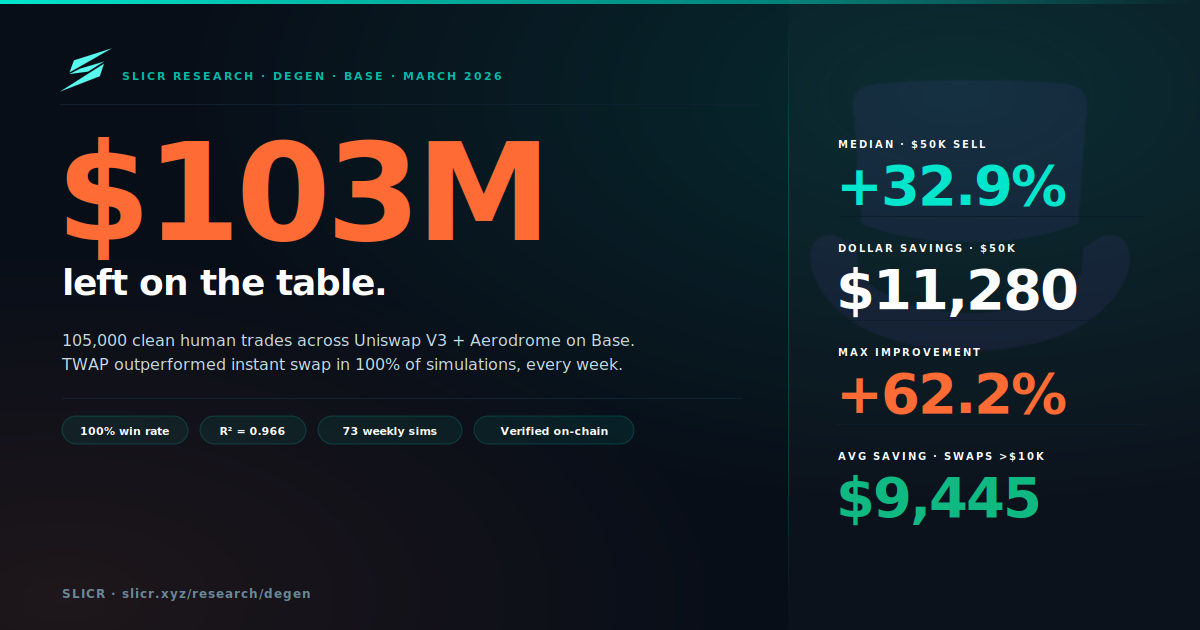
We scanned 8,037,577 on-chain transactions across Uniswap V3 and Aerodrome on Base, fetching 4,184,612 raw DEGEN swaps. Before running any analysis, we applied nine filters to remove bot activity, MEV sandwich attacks, and dust trades. What remained: 105,000 clean human trades — 86,879 on Uniswap V3 and 18,121 on Aerodrome.
Every transaction is verifiable on BaseScan. This is not a model built on synthetic data.
The filtering process removed 97.5% of raw swaps — not because most activity is suspicious, but because high-frequency arbitrage bots and sandwich attackers make up an enormous fraction of DEX volume by transaction count. The 105,000 that survived represent genuine human buy and sell decisions.
What We Found
The core result
We simulated what a Slicr TWAP would have returned versus an instant swap, across 73 weekly periods for five order sizes. The results are medians — central tendency across market conditions, not cherry-picked best cases.
| Order Size | Instant Output | TWAP 24h Output | Improvement | IQR |
|---|---|---|---|---|
| $5,000 | $4,781 | $4,938 | +3.3% (+$157) | [3.1%, 3.6%] |
| $10,000 | $9,160 | $9,783 | +6.8% (+$623) | [6.4%, 7.5%] |
| $25,000 | $20,340 | $23,786 | +16.9% (+$3,446) | [15.9%, 18.6%] |
| $50,000 | $34,289 | $45,569 | +32.9% (+$11,280) | [30.9%, 36.0%] |
| $100,000 | $52,180 | $84,618 | +62.2% (+$32,437) | [58.6%, 67.7%] |
Median values, 73 weekly simulations, Uniswap V3 DEGEN/WETH, 24h TWAP, 10 slices, 30 bps fee deducted.
TWAP outperformed instant swap in 100% of simulations — 73 out of 73 weeks — for orders above $5K. The IQR (interquartile range) is narrow: for $50K orders, 50% of all weeks fall between +30.9% and +36.0%. This improvement is structural and consistent, not episodic.
Why improvement is non-linear
The relationship between order size and TWAP benefit isn't linear — it's convex. A $5K order represents 2.3% of the pool. A $100K order represents 45.8%. The AMM's constant-product formula penalises each additional dollar of order size more than the last. TWAP execution works by breaking the order into slices small enough that each has minimal individual impact, allowing the pool to partially recover between slices via arbitrage.
Pool depth is the primary driver (R² = 0.966)
We ran a linear regression: estimated pool depth against TWAP improvement for $50K orders across all 73 weeks. The result was striking — pool depth explains 96.6% of the variance in how much TWAP helps. The fitted relationship: every additional $10,000 of pool liquidity reduces the median improvement by 1.48 percentage points.
Practical implication: if you know the current pool depth before trading (visible on DexScreener in seconds), you can estimate your expected TWAP improvement. For a $50K order at today's ~$155K pool depth: approximately +42.8%.
Pool liquidity is declining
DEGEN's pool depth has fallen ~29% since the token launched:
- 2024 median: $218,581
- 2025 median: $213,134
- Early 2026: $155,194
This is a common pattern in mature memecoin liquidity — early LPs withdraw as fee revenue declines, leaving a thinner market for remaining holders. The consequence: the TWAP advantage is growing over time. A $50K exit that would have improved by 32.8% in 2024 now improves by 45.2%.
The price direction finding
A common objection to TWAP: "what if DEGEN falls during my 24-hour execution window?" This is a real concern — and it's orthogonal to what we measured. We tested whether the price-impact improvement changes depending on market direction:
| Price regime | Weeks | Median improvement |
|---|---|---|
| Rising (>+5%/wk) | 24 | +33.3% |
| Flat (±5%) | 10 | +33.6% |
| Falling (<−5%/wk) | 38 | +32.9% |
The improvement is statistically indistinguishable across all three regimes. TWAP's benefit comes from AMM mechanics — arb bots restoring the pool price between slices — not from price direction. A bearish seller should still TWAP, then use a shorter duration (4h instead of 24h) to reduce directional exposure.
Aerodrome outperforms Uniswap V3
Aerodrome's volatile pool consistently delivers 2–3 percentage points higher improvement than Uniswap V3 across all order sizes. For $50K orders: Aerodrome +34.8% vs Uniswap +32.9%. Slicr's multi-DEX router routes each slice to the best available price automatically — including Aerodrome when it's deeper.
A Real Example: One Wallet, $437K in Avoidable Losses
Abstract percentages are one thing. Here is a specific, verifiable case.
One wallet executed 11 DEGEN transactions between March and May 2024. We traced every one.
The buys (March–April 2024): Seven purchase transactions totalling 674.30 WETH (~$2.44M). Four of these were executed in rapid back-to-back pairs — each pair deploying ~$1M into a pool with only ~$223K total depth, a 4.5× order-to-pool ratio. The second transaction in each pair struck an already severely dislocated pool, hitting ~82% estimated price impact.
The sells (May 2024): Four sell transactions totalling $1,070,405 USDC received. These went through the DEGEN/USDC pool, which carried ~$1M in TVL — deep enough that each $240K–$292K sell represented only ~1.2% of pool depth. Execution was close to fair value.
| Actual | With Slicr TWAP | |
|---|---|---|
| Net P&L | −$1,370,561 | −$933,717 |
| Improvement | — | +$436,844 |
| Fee cost (30 bps) | — | $10,534 |
| Fee ROI | — | 42× |
Slicr would not have prevented the directional loss — DEGEN fell ~60% between accumulation and exit, and that's a market outcome. What Slicr eliminates is the avoidable price-impact tax on top. This wallet paid an estimated $457,000 in unnecessary buy-side impact. All 11 transaction hashes are in the full report for independent verification.
The Aggregate: $103M Left on the Table
Applying the calibrated improvement rates to all 86,879 Uniswap V3 clean swaps:
| Order bucket | Swaps | Net savings |
|---|---|---|
| $1K–$5K | 131,100 | $4.4M |
| $5K–$10K | 22,108 | $7.2M |
| $10K–$25K | 14,550 | $23.0M |
| $25K–$50K | 3,850 | $30.9M |
| $50K–$100K | 1,460 | $45.9M |
| >$100K | 690 | $94.3M |
| Total | 86,879 | $102,855,439 |
94% of savings — $97M — came from just 10,275 swaps above $10K, which is 11.8% of all trades. The 690 swaps above $100K alone account for $94.3M. The average saving per swap above $10K: $9,445.
These are not projections. They are computed from actual on-chain swap sizes across the two-year dataset, with improvement rates derived from the 73-week simulation.
Caveats
The AMM model used is constant-product (V2 formula), which slightly overstates impact for Uniswap V3 concentrated liquidity — meaning our TWAP improvement numbers are modestly conservative. Pool depth is estimated from rolling swap medians rather than real-time on-chain state. Competing sellers are not modelled.
We report medians rather than means precisely because of these uncertainties — medians are more robust to model error than averages.
Appendix: Methodology
Data: Uniswap V3 subgraph + Aerodrome on-chain data, Base mainnet, Jan 2024 – Mar 2026
Pools: DEGEN/WETH Uniswap V3 0.3%, DEGEN/WETH Aerodrome volatile
Simulations: 73 weekly samples (Uniswap), 47 (Aerodrome), 1,800 total scenarios
AMM model: Constant-product with bps^(−0.3) partial recovery between slices
Fee: 30 bps deducted from all TWAP outputs
Filters: $1K minimum, high-frequency cap, block density, sandwich detection, repeated-amount pattern
Cumulative savings: Log-linear interpolation of improvement rates applied to 86,879 Uniswap V3 swap USD values (105,000 total across both DEXes)
Full methodology and raw data available on request.