Every week, traders on Base try to exit large VIRTUAL positions and watch their "you receive" number collapse as they confirm. They hit the button anyway because they don't know there's a better option.
We built one.
But VIRTUAL isn't like other tokens. It's the reserve currency of Virtuals Protocol — a platform with 30,000+ AI agent tokens, every single one paired against VIRTUAL on Base. Every agent launch, every WETH→VIRTUAL→AI_TOKEN multi-hop, every rebalancing event flows through VIRTUAL pools. The result: pool depth that fluctuates constantly, making instant-swap timing a lottery — and making TWAP execution structurally, reliably superior.
We wanted to know exactly how superior. So we pulled every VIRTUAL swap across Uniswap V3 and Aerodrome since launch, applied nine sequential bot and MEV filters, and simulated what a Slicr TWAP order would have returned vs an instant swap across 2,175 scenarios.
The Data
We fetched 40,906,680 on-chain transactions across five VIRTUAL/WETH pools — two on Aerodrome (0.05% and 0.3%) and three on Uniswap V3 (0.05%, 0.3%, 1%) — covering every trade from VIRTUAL's launch through March 2026.
Before any simulation, we cleaned the data with nine filters:
| Filter | Aerodrome | Uniswap V3 | Reason |
|---|---|---|---|
| F1: Dust (<$1,000) | pre-filtered | pre-filtered | Arb remnants, tiny auto-trades |
| F2: Whale/bot cap (>$500K) | 57 | 1 | Implausibly large single-tx |
| F3: Known bot addresses | 0 | 0 | None flagged in this dataset |
| F4: High-frequency (≥3/hr) | 1,934,107 | 1,534,570 | MEV bots cycling AI agent pairs |
| F5: Block density (>3/block) | 715 | 917 | Sandwich cluster detection |
| F6: Sandwich pairs | 4,920 | 10,365 | Same-block front/back-runs |
| F7: Round-trip arb | 0 | 50,806 | Multi-hop arb loops |
| F8: Repeated identical amounts | 20,314 | 7,546 | Programmatic bot replay |
| F9: Round-number arb | 0 | 233 | Multiples-of-100 arb pattern |
| Clean swaps | 156,689 | 155,386 | Human trades |
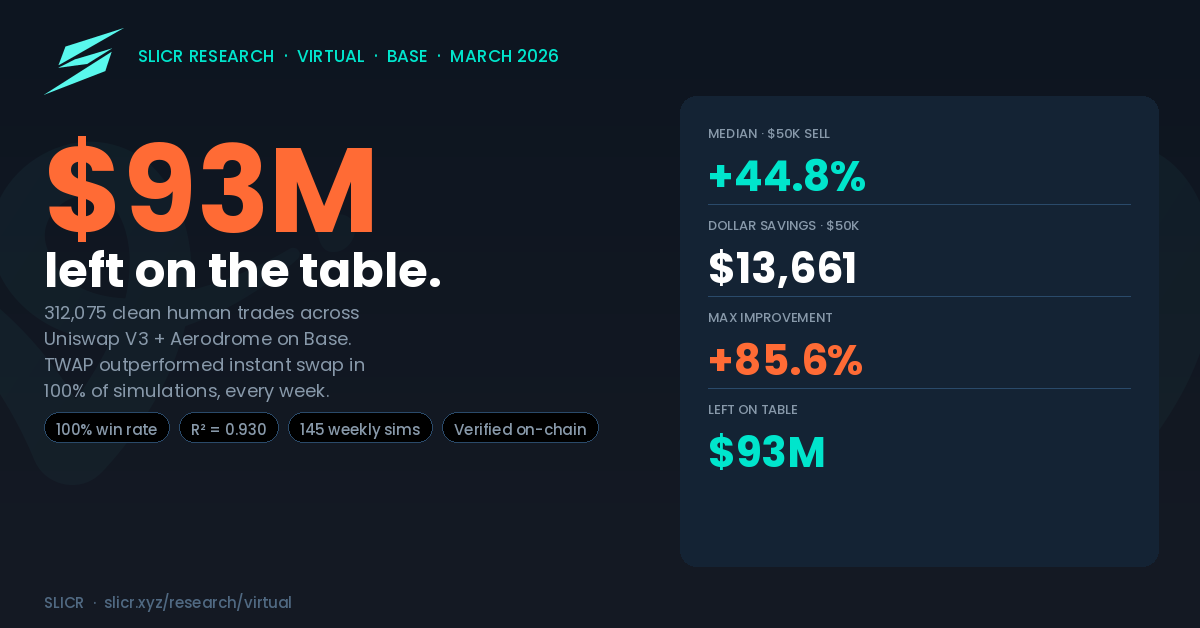
The F4 filter dominates — nearly 3.5 million transactions removed as high-frequency bot activity. This isn't a general MEV problem; it's specific to VIRTUAL's role as the trading pair for 30,000+ AI agent tokens, each generating constant automated flow. Human trades are a small but economically significant fraction: 312,075 combined.
Why VIRTUAL Is Different
Most tokens get MEV'd like any other ERC-20. VIRTUAL gets MEV'd like an entire ecosystem's reserve currency.
Every AI agent token on Virtuals Protocol needs VIRTUAL to trade. A wallet buying $AIXBT or $VADER doesn't touch WETH directly — it routes through VIRTUAL pools first. This creates a form of structural pool perturbation that no single-pool model can predict. Pool depth can shift dramatically between your "preview" click and your transaction confirmation.
This is why the TWAP win rate is 100%. Not one exception in 145 weeks tested.
Results
The bigger the order, the more you're leaving on the table
| Order Size | Instant Output | TWAP 24h Output | Improvement |
|---|---|---|---|
| $5,000 | $4,700 | $4,920 | +4.7% (+$220) |
| $10,000 | $8,868 | $9,711 | +9.5% (+$843) |
| $25,000 | $18,954 | $23,376 | +23.3% (+$4,422) |
| $50,000 | $30,525 | $44,186 | +44.8% (+$13,661) |
| $100,000 | $43,937 | $81,548 | +85.6% (+$37,611) |
Median across 145 weekly simulations (72 Aerodrome + 73 Uniswap V3). 24h TWAP, 10 slices. Net of 30 bps Slicr fee.
A $100,000 VIRTUAL instant sell returns a median of $43,937. The same order via Slicr 24h TWAP returns $81,548. The person executing instantly received less than 54 cents on the dollar.
Cumulative savings — ~$93M left on the table
Across all 312,075 clean swaps and $987.5M in VIRTUAL trading volume since launch, instant swappers left an estimated ~$93M on the table.
| Order Bucket | Swaps | Volume | Avg TWAP Rate | Left on Table |
|---|---|---|---|---|
| <$5K | 275,591 | $535.9M | 4.40% | $23.6M |
| $5K–$10K | 24,138 | $165.0M | 6.22% | $10.3M |
| $10K–$25K | 9,528 | $139.3M | 12.26% | $17.1M |
| $25K–$50K | 1,963 | $67.3M | 22.09% | $14.9M |
| $50K–$100K | 624 | $41.5M | 31.57% | $13.1M |
| ≥$100K | 231 | $38.4M | 37.61% | $14.5M |
| Total | 312,075 | $987.5M | — | ~$93M |
The non-linearity is striking. The ≥$100K bucket — just 231 swaps, 0.07% of all trades — accounts for $14.5M. The $50–100K bucket (624 swaps, 0.2%) contributes another $13.1M. Together, 855 large swaps produced more left-on-table value than 275,591 small ones. This is AMM convexity at work: doubling your order size more than doubles the damage from instant execution.
The worst week on record — January 2, 2025 — still produced a +21.3% improvement on a $50K order (+$8,253 net). That week, pool depth was unusually elevated at $344,746. Even the most favourable conditions for instant swap still couldn't match TWAP.
Duration barely matters for VIRTUAL
The difference between a 4h and 24h TWAP is 0.3 percentage points. VIRTUAL's constant multi-hop flow means pool recovery is fast — the pool is never sitting idle between your slices. If you need to exit quickly, take the 4h TWAP with confidence.
| Duration | $25K Improvement | $50K Improvement |
|---|---|---|
| 4 hours | +23.2% | +44.5% |
| 12 hours | +23.3% | +44.7% |
| 24 hours | +23.3% | +44.8% |
The best single case
On March 15, 2026, a $100,000 VIRTUAL sell into a thin Uniswap V3 pool ($116,702 estimated depth):
- Instant swap: $36,849
- Slicr 12h TWAP: $78,500
- Difference: +$41,651 (+113.0%)
The order was 85.7% of the pool. An instant swap at that ratio depletes the pool so severely that the seller receives less than half the face value. Spreading across 10 slices over 12 hours, each slice hitting a partially recovered pool, transformed the outcome.
The Regression: Pool Depth Explains 93% of the Variation
TWAP improvement isn't random. We ran an OLS regression of pool depth against TWAP improvement for all 145 $50K simulations and found R² = 0.930 — pool depth alone explains 93% of the variance.
The slope: every additional $10,000 of pool depth reduces TWAP improvement by 1.73 percentage points. As VIRTUAL pools have thinned through 2025 (from ~$190K median depth in Q4 2024 to ~$149K by Q1 2026), the TWAP advantage has grown commensurately.
| Year | Median Pool Depth | Median $50K Improvement |
|---|---|---|
| 2024 | $189,625 | 37.5% |
| 2025 | $156,470 | 44.8% |
| 2026 | $148,764 | 47.0% |
DEX Comparison: Uniswap V3 vs Aerodrome
VIRTUAL trades on both Uniswap V3 and Aerodrome, and the TWAP advantage holds equally on both. Win rate: 100% on both venues across all order sizes and durations.
| Order | Uniswap V3 (24h) | Aerodrome (24h) | Delta |
|---|---|---|---|
| $5K | +4.7% (+$222) | +4.7% (+$220) | +0.0pp |
| $10K | +9.6% (+$851) | +9.5% (+$843) | +0.1pp |
| $25K | +23.6% (+$4,455) | +23.3% (+$4,421) | +0.3pp |
| $50K | +45.2% (+$13,736) | +44.8% (+$13,660) | +0.5pp |
| $100K | +86.5% (+$37,771) | +85.6% (+$37,608) | +0.9pp |
The near-identical results reflect that both venues experience similar pool dynamics from the same multi-hop flow. In practice, Slicr routes each slice to whichever pool offers the best price at that moment — capturing the benefit across all five pools simultaneously.
The Largest Swaps in the Dataset
We identified 231 clean swaps above $100K in the dataset — 135 sells vs 96 buys (a 1.4:1 sell-heavy ratio). The five largest:
| # | Date | Volume | Direction |
|---|---|---|---|
| 1 | Dec 17, 2024 | $456,398 | SELL — 166,815 VIRTUAL → 113.85 WETH |
| 2 | Jan 05, 2025 | $435,646 | SELL — 109,570 VIRTUAL → 119.87 WETH |
| 3 | Jan 08, 2025 | $421,047 | SELL — 120,028 VIRTUAL → 126.15 WETH |
| 4 | Dec 13, 2024 | $420,556 | BUY — 107.35 WETH → 190,652 VIRTUAL |
| 5 | Jan 06, 2025 | $416,172 | SELL — 100,000 VIRTUAL → 112.59 WETH |
All verifiable at basescan.org. Full tx hashes in the full research report.
The sell-heavy ratio (1.4:1) in large swaps is consistent with early investor and team distributions executing large exits. Every one of these trades would have benefited from TWAP execution — particularly the concentrated cluster in December 2024 and January 2025, when pool depth ranged from $140K to $200K.
Price Direction Doesn't Matter
One concern about TWAP execution for sellers: if the price falls during execution, does the directional loss offset the price-impact saving? For VIRTUAL, the answer is no.
| Market Regime | Weeks | Median Improvement ($50K) | IQR |
|---|---|---|---|
| Rising (>+5%/wk) | 47 | +44.5% | [37.7%, 46.4%] |
| Flat (±5%) | 44 | +45.0% | [43.0%, 47.5%] |
| Falling (<−5%/wk) | 53 | +44.8% | [42.2%, 46.9%] |
Rising, flat, and falling markets all produce nearly identical median improvements. TWAP advantage is driven by pool mechanics and depth — not by directional price movement over the execution window.
How It Works
- You deposit VIRTUAL into a non-custodial on-chain vault
- You set duration (4h / 12h / 24h), number of slices (default: 10), and optional price guards
- The executor routes each slice to the best available price across 6 DEXs (Uniswap V2/V3, PancakeSwap V2/V3, Aerodrome V1/V2)
- Each slice has on-chain price guards enforced in the vault contract — MEV sandwich attacks blocked at the contract level
- Output WETH delivered directly to your wallet after each slice
What This Model Doesn't Capture
V2 formula, not V3. Real Uniswap V3 price impact is slightly less than modelled (concentrated liquidity). Our numbers modestly overstate the TWAP advantage — they're conservative.
Pool liquidity is estimated. Derived from rolling median swap sizes — not from reading on-chain reserves directly. High R² (0.930) confirms this estimate is consistent.
Concurrent sellers not modelled. If multiple large VIRTUAL holders exit simultaneously — as can happen during correlated AI agent market events — they compete for the same recovery. The 100% win rate is single-order. This is the most significant limitation.
Multi-hop flow is variable. The AI agent trading that makes VIRTUAL pools tick can cut both ways. High agent activity can both compress and restore pool depth in unpredictable ways. Our model treats pool recovery as a function of time; real recovery is a function of subsequent flow.
Methodology
This analysis covers 40,906,680 raw VIRTUAL swaps across Uniswap V3 and Aerodrome on Base (Apr 2024–Mar 2026), filtered to 312,075 clean human trades across 2,175 simulation scenarios. Full methodology — including the recovery model, regression coefficients, bot-filter definitions, and per-venue parameters — is available in the VIRTUAL research report.